Cryptocurrency charts, those arcane arrays of candlesticks and zigzagging lines, encode market psychology into geometric form. Beginners should focus first on candlestick basics—green bodies signaling price increases, red indicating declines—while noting the wicks that reveal price extremes. Volume histograms merit equal attention, as they validate (or contradict) price movements with evidence of trader participation. Moving averages and patterns like head-and-shoulders offer statistical probabilities for future directions. The chart’s seemingly mystical language rewards those who persist beyond initial bewilderment.
Why do cryptocurrency charts often appear as indecipherable as ancient hieroglyphics to the uninitiated observer? The labyrinth of candlesticks, zigzagging lines, and colorful indicators can overwhelm even the intellectually curious, yet these visual representations contain invaluable market intelligence for those who learn their language.
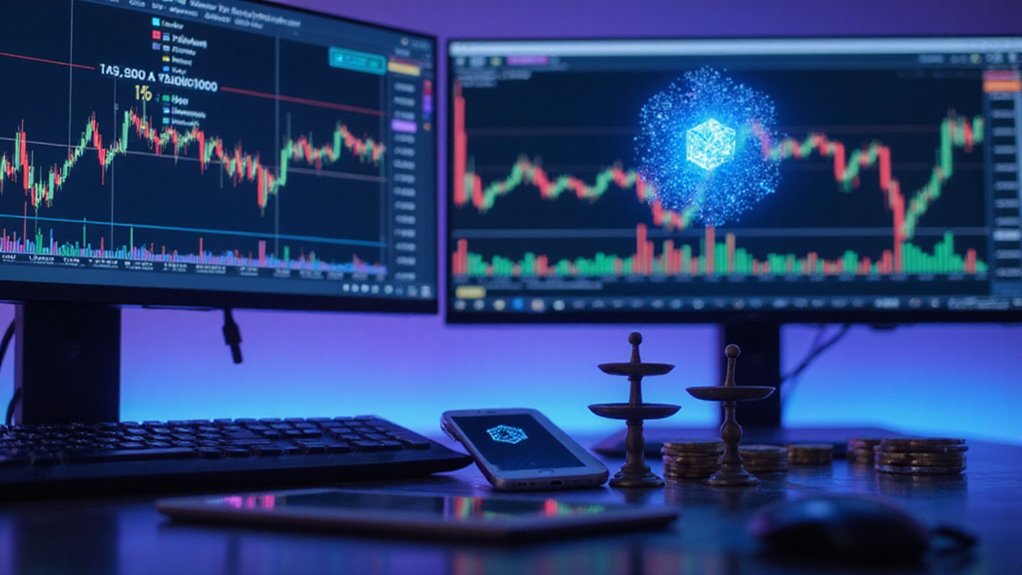
Cryptocurrency charts come in various timeframes—from frenetic one-minute intervals to contemplative weekly views—each serving different analytical purposes.
Line charts offer simplicity by connecting closing prices, while the more nuanced candlestick charts (the preferred format among serious traders) provide a wealth of information within their geometric forms.
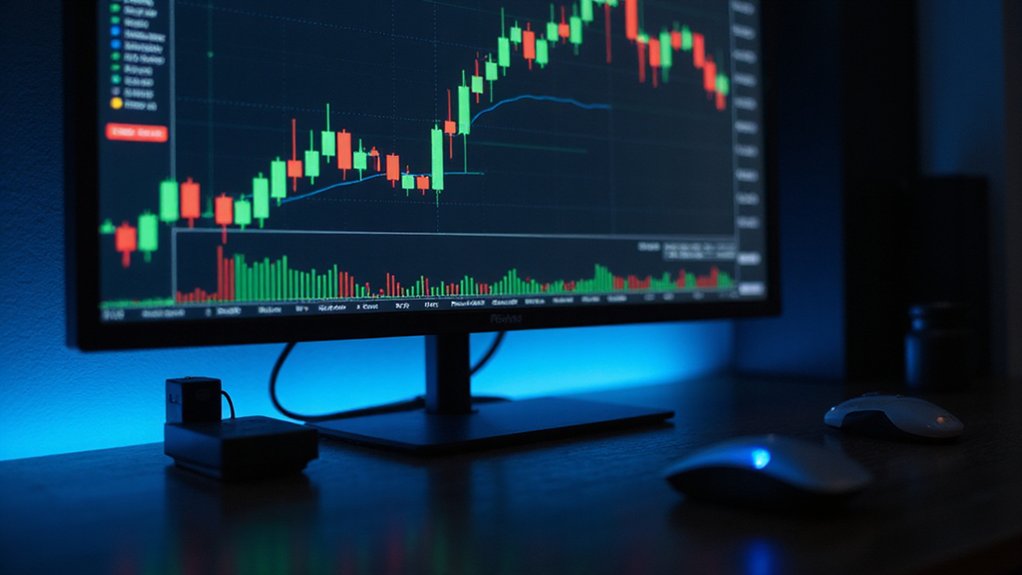
Each candlestick, whether emerald green or crimson red, tells a story of market psychology during a specific period.
The visual language of candlesticks translates raw market emotion into geometric poetry for those fluent in its chromatic syntax.
The anatomy of these candlesticks merits careful examination.
The rectangular “body” represents the opening and closing prices (the difference determining its color), while the thin “wicks” extending outward reveal the highest and lowest prices reached during that timeframe.
This visual shorthand allows traders to immediately comprehend price volatility without drowning in numerical data.
Volume indicators, those often-overlooked histograms typically residing at the chart’s bottom, deserve equal attention.
They quantify market participation—the lifeblood of price movement.
Substantial volume accompanying a price surge suggests conviction, while price advances on anemic volume may portend an imminent reversal (caveat emptor).
Pattern recognition constitutes another essential skill.
Charts frequently form recognizable configurations—head-and-shoulders, triangles, wedges—that, while not infallible, provide statistical probabilities about future price direction.
These patterns emerge regardless of asset class or time period, reflecting the remarkably consistent nature of crowd psychology.
Most charting platforms offer supplementary analytical tools like moving averages and relative strength index (RSI) that provide mathematical context to visual observations.
These indicators, when judiciously applied rather than haphazardly accumulated, can substantiate or contradict one’s market hypothesis.
The price movement interpretation becomes clearer when you understand that green candlesticks indicate bullish periods where closing prices exceeded opening prices, while red signals bearish sentiment.
The cryptocurrency chartist’s journey begins with fundamental understanding but culminates in developing an intuitive feel for market rhythms—a skill acquired not through memorization but through patient observation of these digital canvases over time.
Traders often analyze charts using logarithmic scale when viewing long-term cryptocurrency trends as it better represents percentage changes during periods of extreme volatility.
Understanding chart analysis becomes particularly valuable when analyzing major cryptocurrencies like Bitcoin and Ethereum, which frequently establish patterns that smaller altcoins tend to follow.
Frequently Asked Questions
What Indicators Are Best for Day Trading Versus Long-Term Investing?
Day traders benefit from responsive, short-term indicators: RSI highlights overbought/oversold conditions, MACD captures momentum shifts, Bollinger Bands track volatility, and volume analysis confirms breakouts.
Long-term investors, however, thrive with trend-identifying tools: 200-day SMAs establish macro direction, Fibonacci retracements pinpoint strategic entry zones, OBV tracks accumulation phases, and ADX quantifies trend strength.
The former group needs real-time sensitivity; the latter requires noise-filtering patience—different temporal horizons demanding appropriately calibrated technical lenses.
How Can I Identify Market Manipulation on Cryptocurrency Charts?
Identifying market manipulation on cryptocurrency charts requires vigilance for several telltale patterns: unusual volume spikes without corresponding price movements (classic wash trading), Wyckoff distribution phases orchestrated by whales, artificial triangular formations preceding coordinated pumps, and price movements that defy market fundamentals or news.
On-chain analysis further reveals suspicious wallet activities, while monitoring order book anomalies—particularly large walls that mysteriously vanish—can expose spoofing attempts.
Ultimately, when volume and price behavior appear detached from reality, manipulation likely lurks beneath.
When Should I Use Logarithmic vs. Linear Scale Charts?
Investors should deploy logarithmic scales for long-term analysis (>1 year) or when examining assets with significant price volatility—a category that, unsurprisingly, includes most cryptocurrencies.
Log charts reveal percentage-based movements and properly contextualize historical performance without the distortion that linear scales introduce.
Conversely, linear charts serve short-term traders better (<6 months), particularly when absolute price levels matter for setting fixed stop-losses or evaluating stablecoins that shouldn't exhibit dramatic percentage swings.
How Do Futures Contracts and Options Affect Cryptocurrency Price Charts?
Futures and options cast long shadows over cryptocurrency charts, often dictating price action beyond their theoretical secondary role.
These derivatives inject volatility through leverage-induced liquidation cascades while creating technical support/resistance at key strike prices.
Chart readers ignore funding rates and open interest at their peril; quarterly expirations reliably generate volatility clusters, while “max pain” theory manifests as price gravitating toward strikes where option sellers profit most.
The tail, as they say, increasingly wags the dog.
Can Chart Patterns Predict Specific Price Targets With Reliable Accuracy?
Chart patterns offer probabilistic rather than deterministic price targets.
While statistical models suggest certain reliability rates (Head and Shoulders boasts 76% success), cryptocurrency’s notorious volatility undermines precision.
External factors—news cycles, regulatory shifts, market sentiment—frequently render the most elegant technical projections moot.
Combining multiple indicators (MACD, RSI) improves accuracy, but the market’s complexity defies consistent prediction.
Pattern breakouts do enhance reliability, yet seasoned traders view targets as guidelines rather than guarantees.