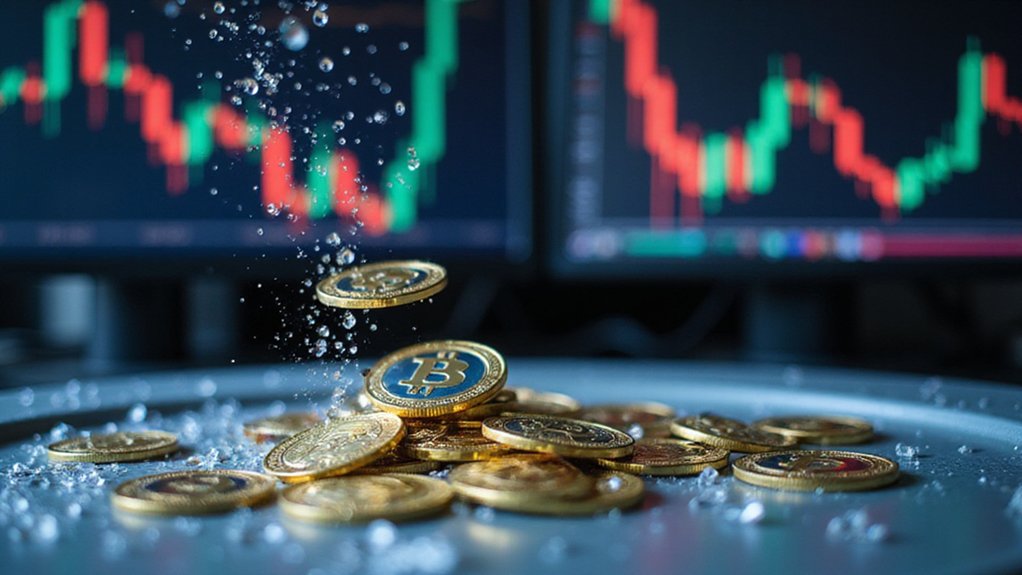
The cryptocurrency markets have once again demonstrated their capacity for confounding conventional wisdom, as Bitcoin experiences a notable decline precisely when one might expect strength, while XRP—long the perpetual underperformer in many traders’ portfolios—manages a modest ascent that feels almost quaint by digital asset standards.
The culprit behind Bitcoin’s counterintuitive behavior appears to be the easing of US-China trade tensions, which one might reasonably assume would benefit all risk assets.
Instead, reduced geopolitical friction has prompted investors to migrate toward traditional equities, leaving Bitcoin somewhat abandoned at the digital crossroads.
The irony is palpable: positive global developments create negative outcomes for an asset that supposedly thrives on uncertainty.
Bitcoin’s supposed chaos-hedge credentials crumble when actual stability emerges, revealing the uncomfortable truth about manufactured digital safe havens.
Bitcoin’s relationship with the S&P 500 has reached an 83% correlation over the past thirty days, effectively transforming the world’s premier cryptocurrency into something resembling a particularly volatile tech stock.
This convergence challenges Bitcoin’s carefully cultivated narrative as a hedge against traditional market turbulence—a role that apparently evaporates the moment actual hedging becomes unnecessary.
Meanwhile, XRP’s relative outperformance (and we use that term generously) stems partly from its insularity against macroeconomic headlines.
While Bitcoin traders obsess over trade tariffs and Federal Reserve pronouncements, XRP operates within its own ecosystem of regulatory developments and institutional adoption announcements.
Some investors, apparently exhausted by Bitcoin’s mercurial relationship with global events, have rotated into XRP seeking diversification from their primary holding’s newfound correlation with equities. Understanding candlestick charts and their detailed price information helps traders analyze these rotation patterns and identify potential trend reversals in both Bitcoin and XRP markets.
The broader context reveals profit-taking behavior among Bitcoin holders who, having witnessed recent gains, decided that locking in returns trumped riding the volatility rollercoaster indefinitely. Adding to the selling pressure, whale accumulation has slowed significantly, with large holders accumulating 122,330 coins over six weeks but showing signs of reduced buying activity.
This mechanistic selling pressure coincides with reduced safe-haven demand, creating downward momentum that trade optimism paradoxically accelerates rather than alleviates.
External factors compound these dynamics, with ambiguous cryptocurrency headlines adding pressure while strengthening equity markets continue diverting capital from digital assets. Despite this current weakness, technical analysis suggests Bitcoin faces key resistance levels between $110,000 and $120,000 that could determine whether a significant breakout materializes.
The result is a market environment where good news becomes bad news, underperformers briefly shine, and correlations that shouldn’t exist dominate price action.
June emerges as a pivotal month for determining whether these divergent trends represent temporary market confusion or a more fundamental realignment of crypto asset relationships.


